Back to projects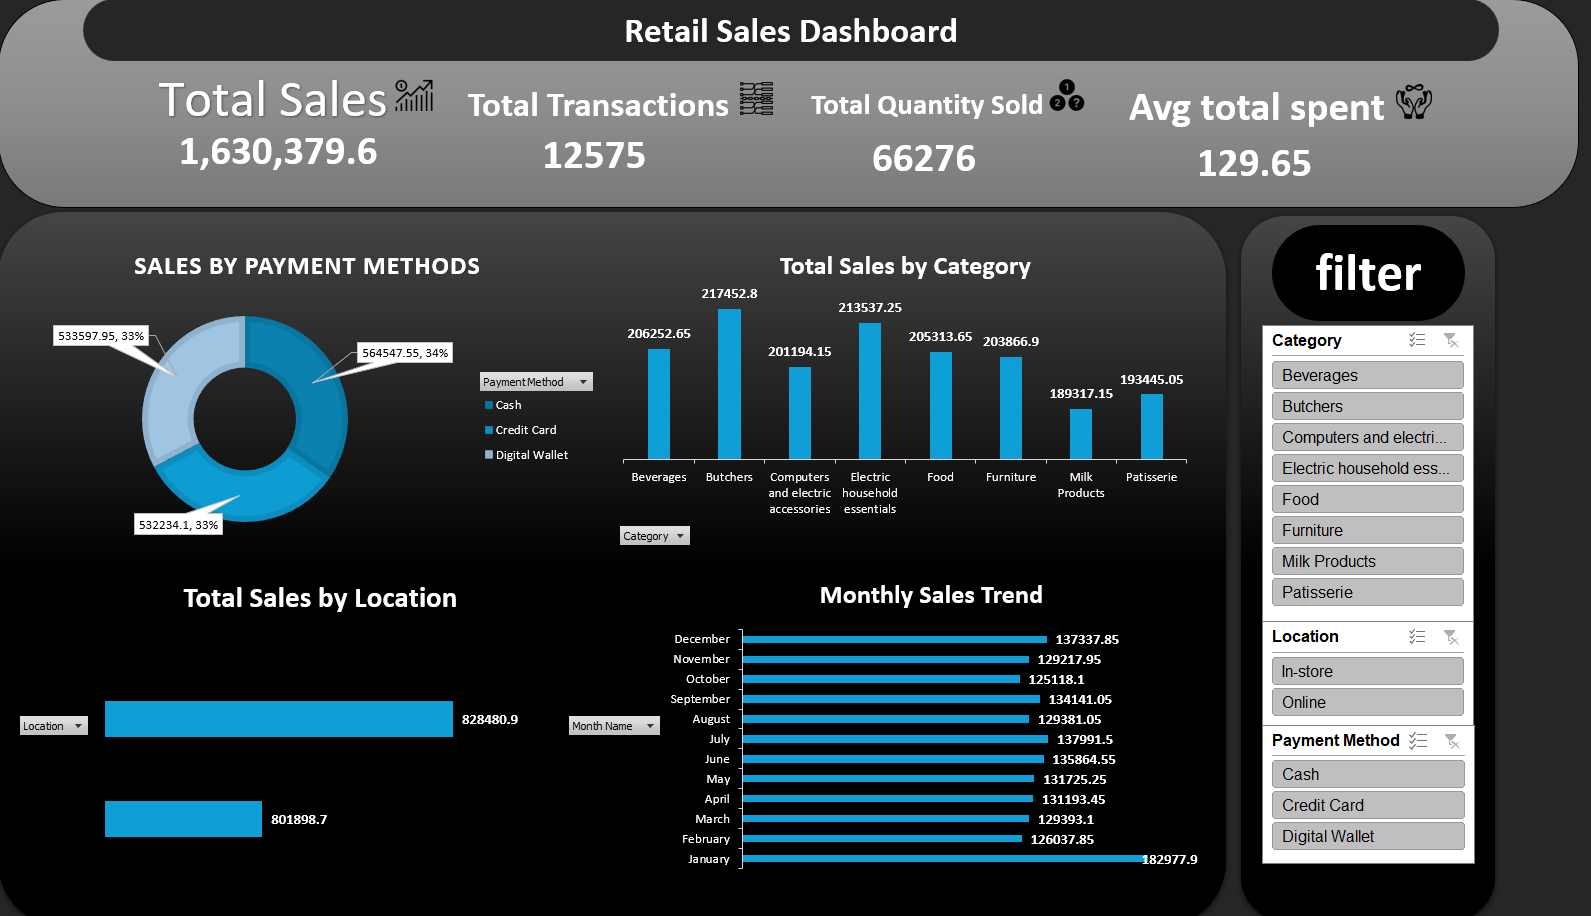
Sales Analytics
Retail Sales Dashboard
Interactive dashboard analyzing retail sales performance across products, payment methods, categories, locations, and monthly trends. Built to give retail leadership one unified view of revenue drivers.
$1.63M
Total Sales
12,575
Transactions
66,276
Quantity Sold
$129.65
Avg. Spend
Business Problem
Retail leadership needed a unified view of sales across categories, channels, and payment methods to identify growth levers and pricing opportunities.
Tools & Tech
Power BIPower QueryDAXData Modeling
Key Insights
- Total sales reached $1.63M with balanced contributions across Cash, Credit Card, and Digital Wallet.
- Butchers and Electric Household Essentials categories generated the highest revenue.
- Online and In-store sales were nearly balanced, confirming a healthy omnichannel mix.
- Monthly sales remained stable with clear seasonal peaks in January and December.
Skills Demonstrated
Data ModelingKPI DesignStorytellingExecutive Reporting
Business Impact
Empowered category managers to rebalance inventory toward high-margin categories and align promotions with seasonal peaks.