Back to projects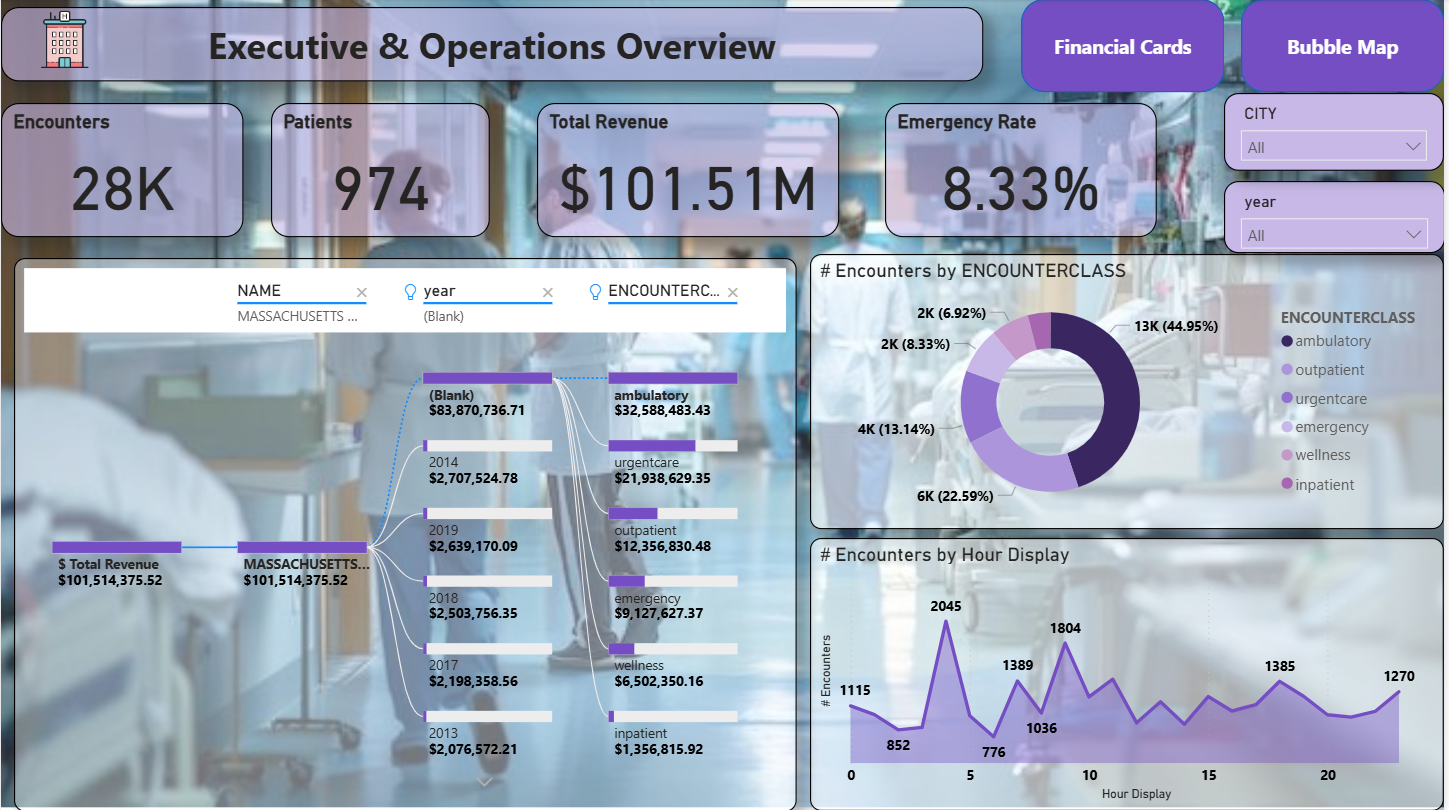
Executive & Operations Overview 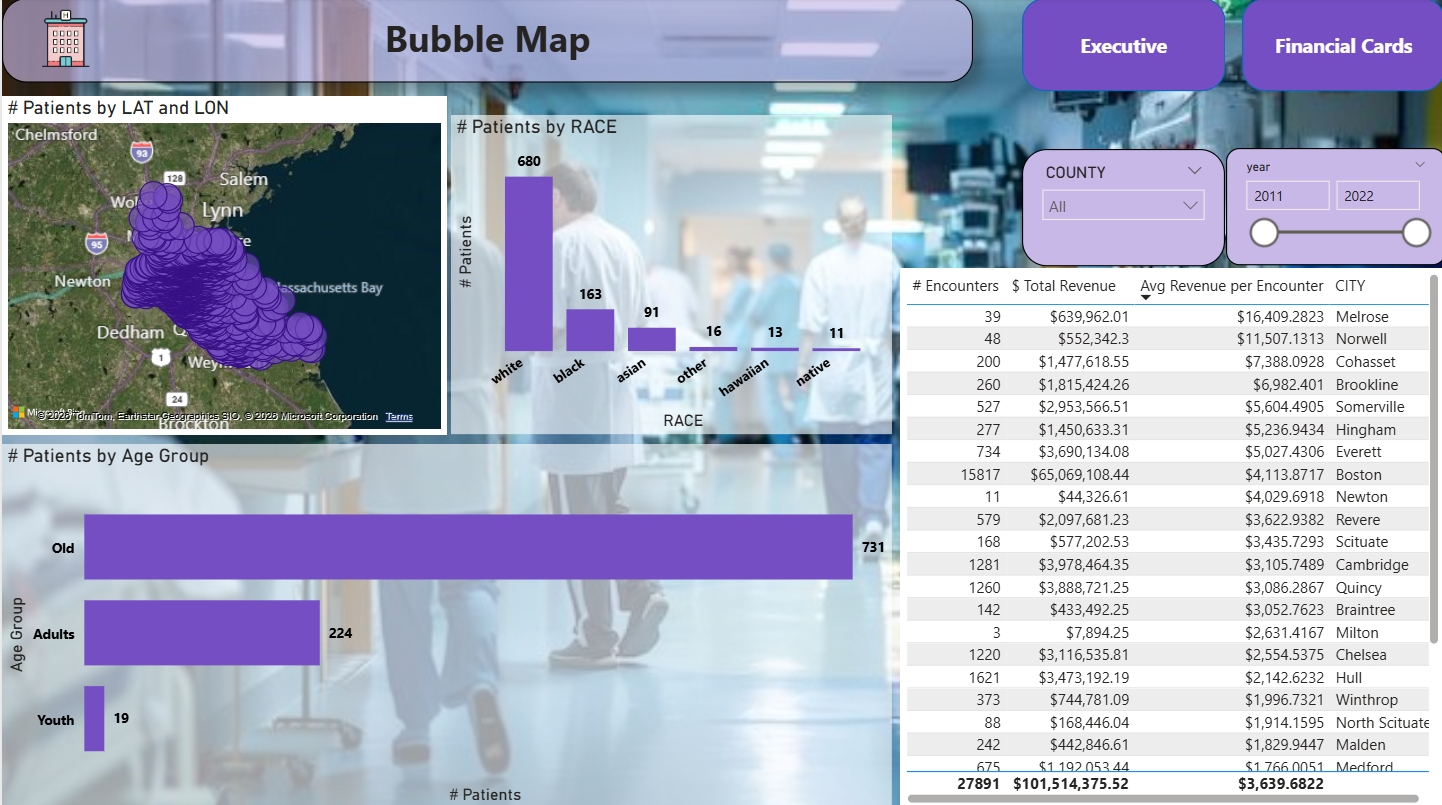
Patient Geographic Analytics
Healthcare Analytics
Healthcare Executive Dashboard
Executive dashboard for monitoring hospital operations, patient encounters, revenue, emergency visits, and healthcare performance across service lines and geographies.
28K
Encounters
974
Patients
$101.5M
Revenue
8.33%
Emergency Rate
Dashboard Views
Business Problem
Executives needed a single pane of glass for revenue, encounter volumes, and daily patient activity across service lines and cities.
Tools & Tech
Power BIDAXHealthcare Analytics
Key Insights
- Total Revenue exceeded $101.5M across 28K encounters and 974 patients.
- Ambulatory encounters dominated at ~45% of total volume.
- Emergency Rate held at 8.33% — a focal metric for capacity planning.
- Peak patient activity occurred mid-morning; Boston drove the largest share of encounters.
Skills Demonstrated
Geo AnalyticsSankey ModelingKPI DesignExecutive Reporting
Business Impact
Informed staffing decisions around peak-hour ambulatory visits and prioritized investment in high-volume service lines.